Intermediate Excel for Data Analysis


Bell Work: (5min)
- Log into your Office 365 Account and open the Link in your Email entitled Intermediate Excel
- Open the Word document with today’s agenda
- Open the Intermediate Excel Workbook Edit
Intermediate Excel Agenda
Descriptor: Learn to use some of the more advanced features and functions in Microsoft Excel 2013/2016 in this hands-on workshop. TN State standards include data interpretation by students in a variety of ways. This training is designed for those participants who have previously attended Basic Excel and are ready to learn how to create tables and build a basic database, use conditional formatting to filter grades by color, protect worksheets and workbooks, go a step further in chart creation and insert them into PowerPoint Presentations. Participants will learn how to use concatenate, text to columns, and find and replace, which are valuable tools for data analysis. Lastly participants will learn how to create an Excel Survey and collect data for analysis charts in PowerPoint.
Objectives/Success Criteria:
- Task 1: Participants can use the Search Feature in Excel to navigate.
- Task 2: Participants will find data and replace it with new data using the Find and Replace feature.
- Task 3: Participants will use the Concatenate formula to combine 2 different columns of information.
- Task 4: Participants will separate data from one column to 2 separate columns using the Text to Columns feature.
- Task 5: Using Conditional Formatting participants will color code data.
- Task 6: Participants will use basic functions to average data.
- Task 7: Participants will explore the Protect workbooks and worksheets features in Excel.
- Task 8: Participants will use Data Forms to enter information quickly.
- Task 9: Participants will watch a video and explore Charts in Excel.
Team Rubric: Use of Data, Planning
ISTE / Digital Citizenship:
ISTE Standard for Students: collect data or identify relevant data sets, use digital tools to analyze them, and represent data in various ways to facilitate problem-solving and decision-making
ISTE Standards for Teachers: model and facilitate effective use of current and emerging digital tools to locate, analyze, evaluate, and use information resources to support research and learning
Digital Citizenship Component: Privacy
PLC:
- What is it we want our students to learn?
- How will we know if each student has learned it?
- How will we respond when some students do not learn it?
- How can we extend and enrich the learning for students who have demonstrated proficiency?
Intermediate Excel
Task One
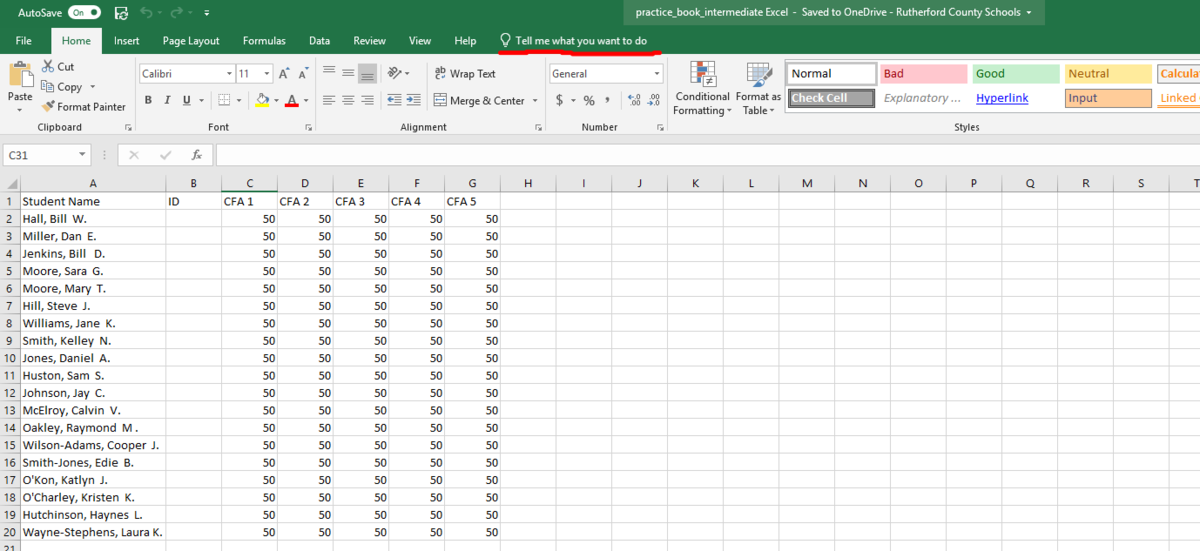
Go over the search feature in Excel with participants. Example: When the tech coach says go to Find and replace do not waste time trying to figure out where that is. Go to the search box and type in find and replace.
*Search box is underlined in red.
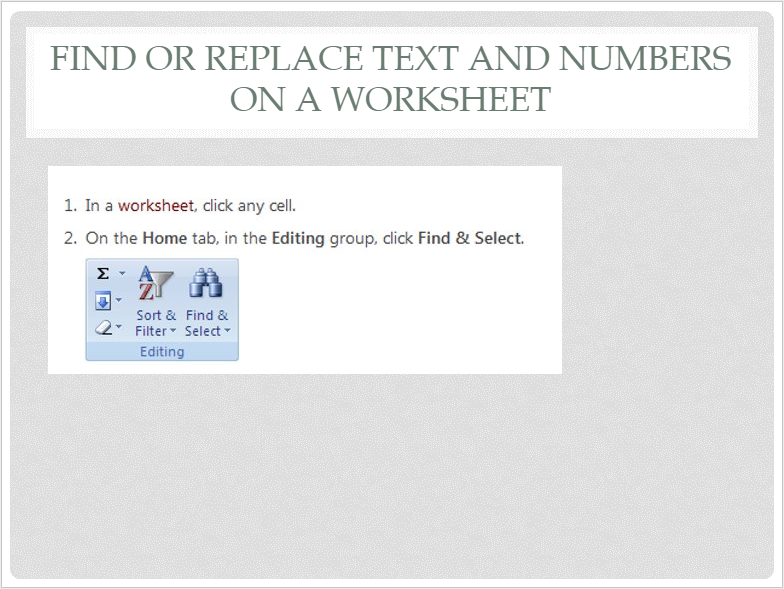
Task Two: Find and Replace
- Click on any cell in the workbook on the find and replace worksheet
- Go to the search box and type in Find and Select
- Click on Find
- Type in 100 in the box and then click on the replace tab
- Type 50 in the replace box and choose replace. Notice the 100’s turned to 50’s.

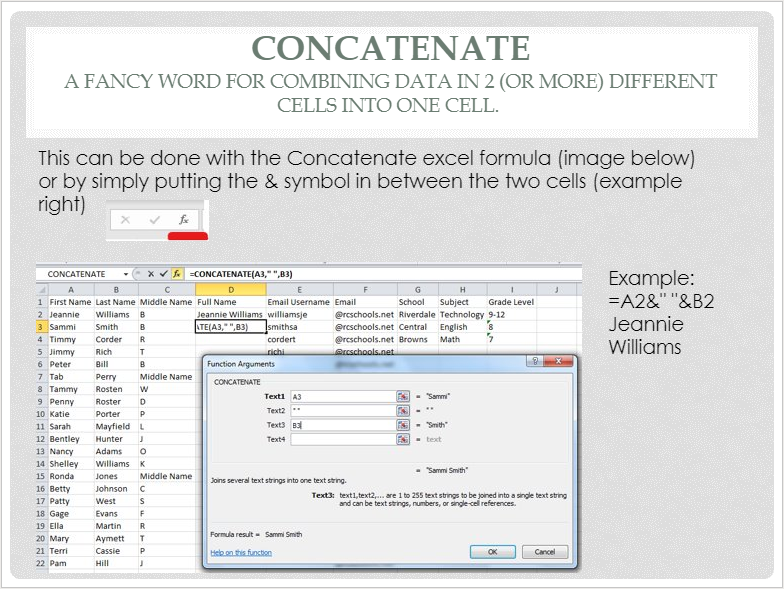
- Task Three: Concatenate
- Have participants click on the concatenate worksheet in the practice workbook
- Discuss what Concatenate means and how it can be used. In the practice workbook and the concatenate tab explain the goal is to get the First Name Column and the Last Name column of information into one column under the Full Name heading.
- Click in Cell D2
- In the search box, Search for Concatenate or CONCAT the abbreviation. Click Text Functions and choose CONCAT.
- In Text 1 box choose the first name Jeannie (A2)
- In Text 2 Type “ “ with a space in between the quotations. This creates a space in between the first and last name.
- In Text box 3 choose the last name: Williams (B2)
- Click Ok
- Once this is complete you can autofill the formula for the rest of the names. Autofill can be done by simply clicking in cell D2 and hover the mouse in the bottom right corner of the cell until a plus sign appears. Drag this down and it will copy the formula.
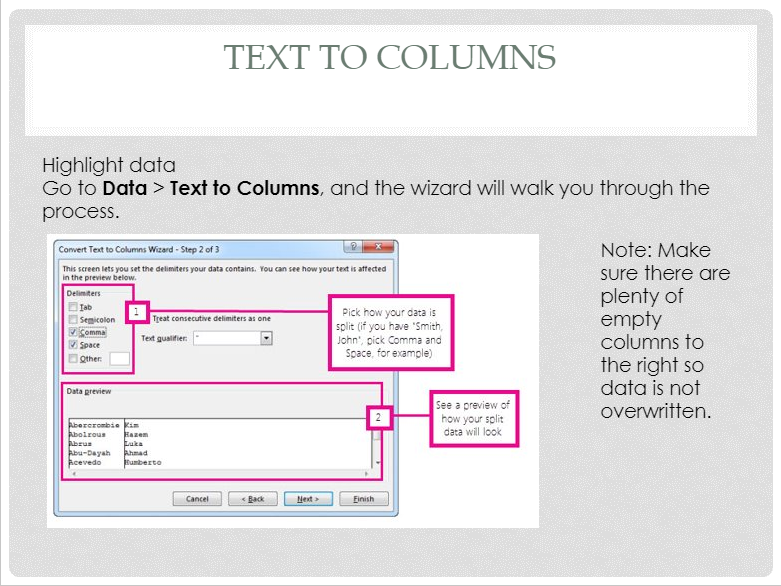
Task Four: Text to Columns
- Have participants click on the Text to Columns worksheet at the bottom on the workbook
- Right click on CFA 1 column and insert in 4 columns.
- Highlight the Student Names Hall, Bill to Wayne- Stephens, Laura. Go to the Data tab in the ribbon choose Text to Columns. The Data Wizard will walk you through the process.
- Data Wizard:
- Select the Destination Cells where the new data will go and click finish.
- Click on the Conditional Formatting worksheet
at the bottom on the workbook
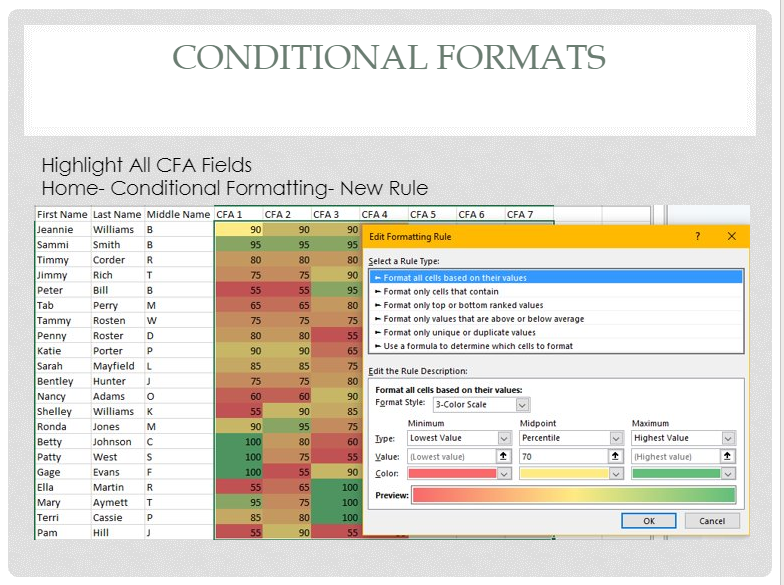
- Conditional Formatting creates assorted colors for numbers. In this example students CFA grades will be color coded to easily see who is passing or failing.
- In the search box type conditional formatting, choose Color scales and choose the Green-Yellow-Red Color Scale
- Highlight all CFA Data Fields
- Type in the search box again conditional formatting and choose New Rule
- In the New Rule Box choose format cells based on their values. Chose Format Style 3-Color Scale. In the Mid Point Box, Type 70 for the Value.

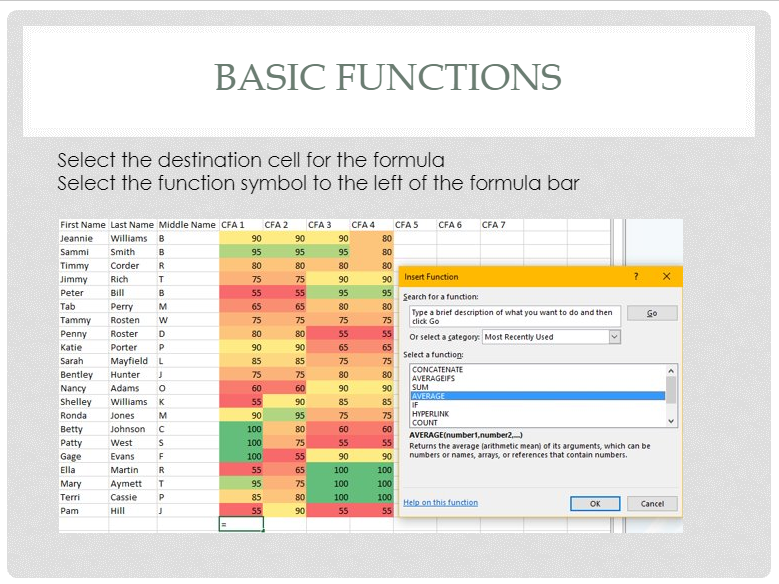
- Click in Cell D23. Select the function (fx) symbol on the
toolbar.
- A function box will appear. Choose the category Most recently used
- Select Average, then OK
- Autofill can also be done horizontal. Autofill the averages for the other CFA’s.
- Have participants Average individual student’s averages and autofill
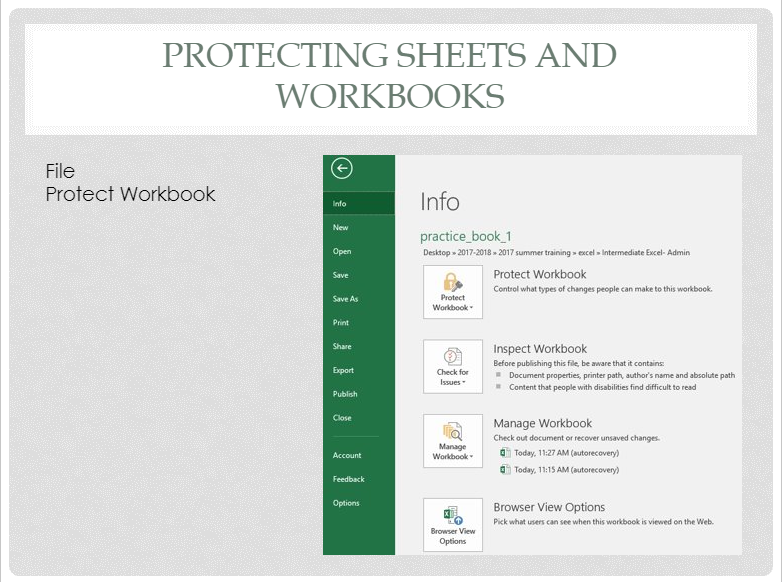
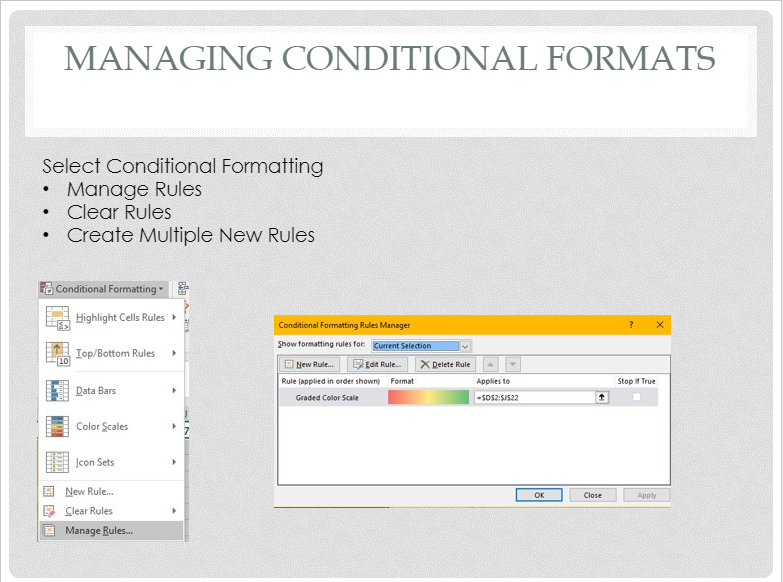
- What would be reasons a workbook or a Worksheet might need to be protected (locked).
- Click on File tab
- Click Protect Workbook
- Go over options with the participants
- Right click on the Charts Worksheet and Choose Insert
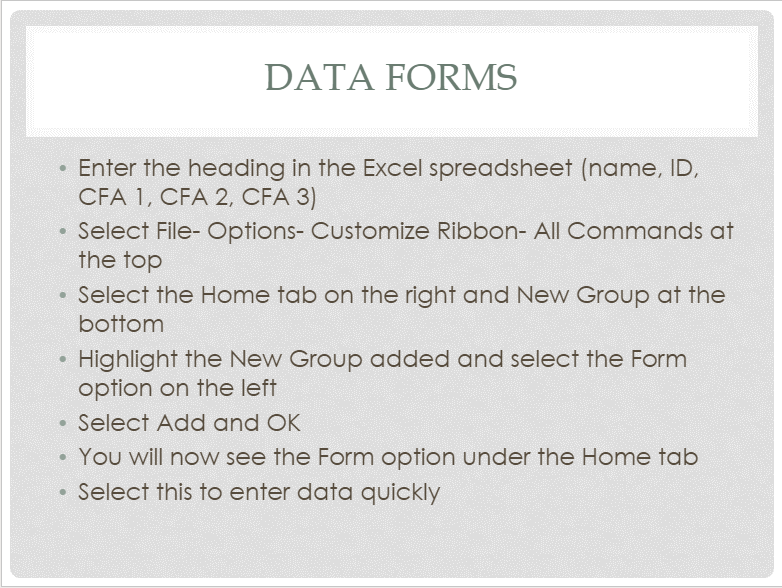
- On the New worksheet create headings for:
name, ID, CFA 1, CFA 2, CFA 3
- Click on File, then Options
- A box will appear click on Customize Ribbon
- Click All Tabs in the drop-down Menu
- Next, click under Main tabs the word Home
- At the bottom choose New Group
- From the All Commands list, scroll down and find Forms
- Click Add, then OK

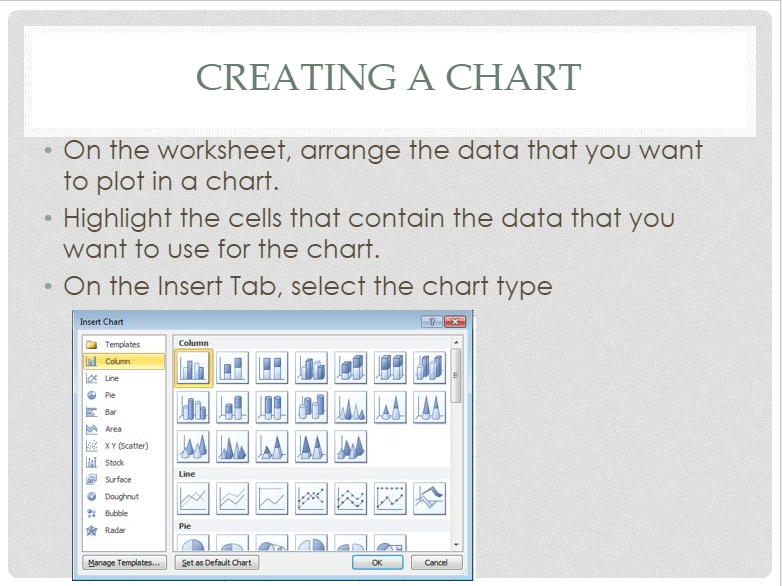
Create a chart Written Directions:
-
Select data for the chart.
-
Select Insert > Recommended Charts.
-
Select a chart on the Recommended Charts tab, to preview the chart.
Note: You can select the data you want in the chart and press ALT + F1 to create a chart immediately, but it might not be the best chart for the data. If you don’t see a chart you like, select the All Charts tab to see all chart types.
-
Select a chart.
-
Select OK.
Add a trendline
-
Select a chart.
-
Select Design > Add Chart Element.
-
Select Trendline and then select the type of trendline you want, such as Linear, Exponential, Linear Forecast, or Moving Average.


